 The IPCC’s1 sixth assessment report (AR6) was released in August 2021, and it offers some firm conclusions. With less equivocation, the United Nations panel that prepared AR6 provides the strongest evidence to date and concludes: sea levels are rising faster and will not stop rising this century, even if there are major reductions in greenhouse gasses.
CSE has prepared this summary of findings to highlight the problem of sea level rise (SLR) and outline feasible approaches for managing it. We focus on the likely range of SLR along the US East Coast, which in simple terms, is 2–3 feet (ft) by the year 2100. We demonstrate ways that beaches naturally keep pace with SLR or can be maintained with moderate inputs of sand, whereas sheltered shorelines around sounds and along marshes may not keep pace with SLR and will likely be much more expensive to maintain. Different responses will be required for exposed vs sheltered coastal areas.
IPCC Key Findings
There are some key takeaways from the 2021 IPCC report:
First, climate change over the past century has been primarily human-caused. Since 1900, the industrial age and man-made activities have accounted for ~1.1°C of global warming. By comparison, natural drivers of temperature only accounted for about 0.1°C of change. In other words, the net impact of emissions we can control, like car exhaust and electricity generation, was 10 times worse than natural emissions we cannot control, like volcanic eruptions and climate cycles.
Second, human influence is “very likely” the main driver of the retreat of glaciers and ice sheets since the 1990s, including the Greenland ice sheets. The melting of glaciers perched over land leads directly to rising seas. Melting of sea ice, by comparison, does not affect sea levels (remember the ice cube in a glass of water experiment!). However, the human-caused reduction in the area of Arctic ice leads to less reflection of solar radiation back into space. When the earth’s ice caps shrink, more heat is absorbed, leading to warmer ocean temperatures. A significant portion of the observed sea level rise over the past century is the thermal expansion of seawater, and warmer oceanic waters are the principal drivers of more frequent and intense hurricanes.
But, of most concern for coastal communities, sea level is rising faster due to these human drivers of climate change. Global mean sea level rose 20 centimeters (cm) (~8 inches) between 1901 and 2018. However, during the first seventy years (1901–1971), the rate of rise was only 1.3 millimeters per year (mm/yr) (a total of ~9 cm). Since 2006, the observed rate of rise has been 3.7 mm per year (about 4.6 cm in only 12 years). This is less surprising when global temperatures are considered. The IPCC AR6 report found that mean temperature has increased every decade over the past 40 years.
The effects of global warming on ocean and coastal systems are wide-ranging, including changes in rainfall patterns, acidification of ocean waters, bleaching of corals, and intensification of storms. Bear in mind, inland areas are expected to be impacted as well by moisture variability, which brings with it cascading impacts on water resources and food production. All of these effects were predicted by early climate models in the 1980s.2 Forty years later, there are direct observations confirming these predictions. That is why this latest IPCC report can profess more certainty than earlier ones and why the calls for action should not be ignored.
Probabilities
The new IPCC report is less equivocating and uses terms like “virtually certain” (a 99–100% probability), “extremely likely” (95–100%), or “very likely” (90–100%) to help quantify what to expect. CSE has advocated that coastal communities focus on climate change scenarios with a high probability of occurrence rather than the extreme possibilities with low probability. While a 2 meter (~6 ft) sea level rise in the next 80 years makes the better headline, a 2 ft rise is more likely.
IPCC also refers to events or scenarios of change that are “exceptionally unlikely” (0–0.1% chance of occurrence) or “very unlikely” (0–1% chance of occurrence). The possible but highly unlikely extremes are grounds for concern. But remember: when it comes to sea level rise at the coast, the very likely must occur long before the extremely unlikely. Sea level cannot rise six feet (unlikely by 2100) before it rises two feet (very likely).
Communities should monitor the rate of rise at their locality and compare it with the various IPCC scenarios to determine the appropriate level of response. Communities in doubt about long-term projections can at least plan for a shorter period of 20–30 years, then update the plan as actual SLR measurements become available.
NASA/EPA Predictions in the 1980s
The US EPA retained CSE in the 1980s to help evaluate potential impacts of SLR around Charleston.3 Working with experts in global climate modeling, we were given a broad range of scenarios to consider. Nearly 40 years later, we can confirm which SLR projections from the 1980s were closest to actual events.
Predictions of global warming and sea level rise have been made for half a century using increasingly sophisticated models calibrated by worldwide measurements of temperatures and tides. Interestingly, the scenarios projected by NASA’s Goddard Space Institute and the US EPA in the 1980s are in the same order of magnitude as the IPCC’s latest predictions. That range for SLR, in simple terms, is 1–10 feet over approximately one century.
The EPA4 presented four scenarios of SLR for Charleston (SC), using 1980 as the starting year, 2025 as the mid-point, and 2075 as the “century” projection (Table A). The “Baseline” scenario was a projection of the 20th Century observed SLR. For Charleston, that meant combining the eustatic (global) sea level trend with the local rate of land subsidence. As Table A shows, Charleston was expected to experience a relative rise of 11.2 cm (0.4 ft) by 2025 and 23.8 cm (0.8 ft) by 2075. The “low” scenario (with a lower probability than the “Baseline”) anticipated rises of 28.2 cm (2025) and 87.6 cm (2075). So built into this low scenario of roughly 1 ft and 3 ft rise for the target dates was the assumption of accelerated SLR over time. The “medium” and “high” scenarios raised these projections to as much as eight feet by 2075 (Table A).
Nearly forty years have passed since the EPA SLR scenarios were developed. So how do those scenarios compare with the actual measurements through 2020 in the Charleston area?
The Permanent Service for Mean Sea Level (Liverpool UK) maintains the long-term record for Charleston. Between 1980 and 2020, mean sea level rose 166 mm (4.15 mm/yr) or a total of ~6.5 inches (Figure A). This places the actual SLR about midway between the “Baseline” and “Low” scenarios projected by the EPA (for 1980–2025). The rate of rise has fluctuated over a wide range from year to year, or decade to decade, with some years experiencing a slight drop in mean sea level and other years a rapid rise. The “10-year” floating average mean sea level curve in Figure A shows a stair-step trend whereby specific decades (the 1930s-1940s, 1990s, and 2010s) show greater than normal SLR and several decades (1950s, 1960s, 1980s, and 2000s) exhibit only small changes in mean sea level.
TABLE A. Sea level rise scenarios for Charleston, 1980-2075 (in centimeters with feet in parentheses). 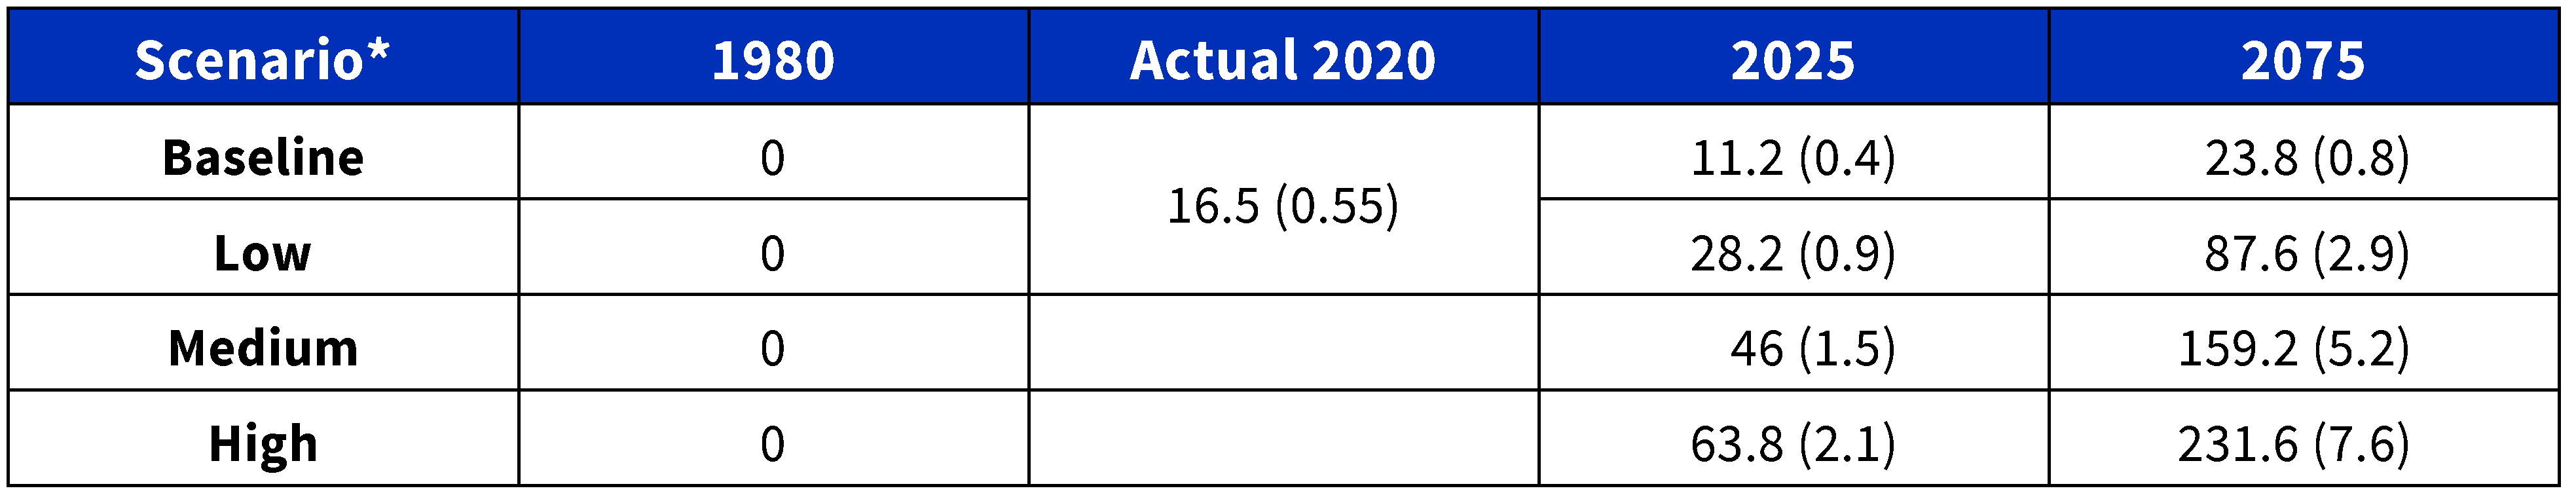
Source: Global sea level rise scenarios modified to reflect local conditions based on the historical trends for Charleston.5 Baseline scenarios for each year reflect actual trends during the 20th century. Other scenarios reflect accelerated sea level rises at various rates.
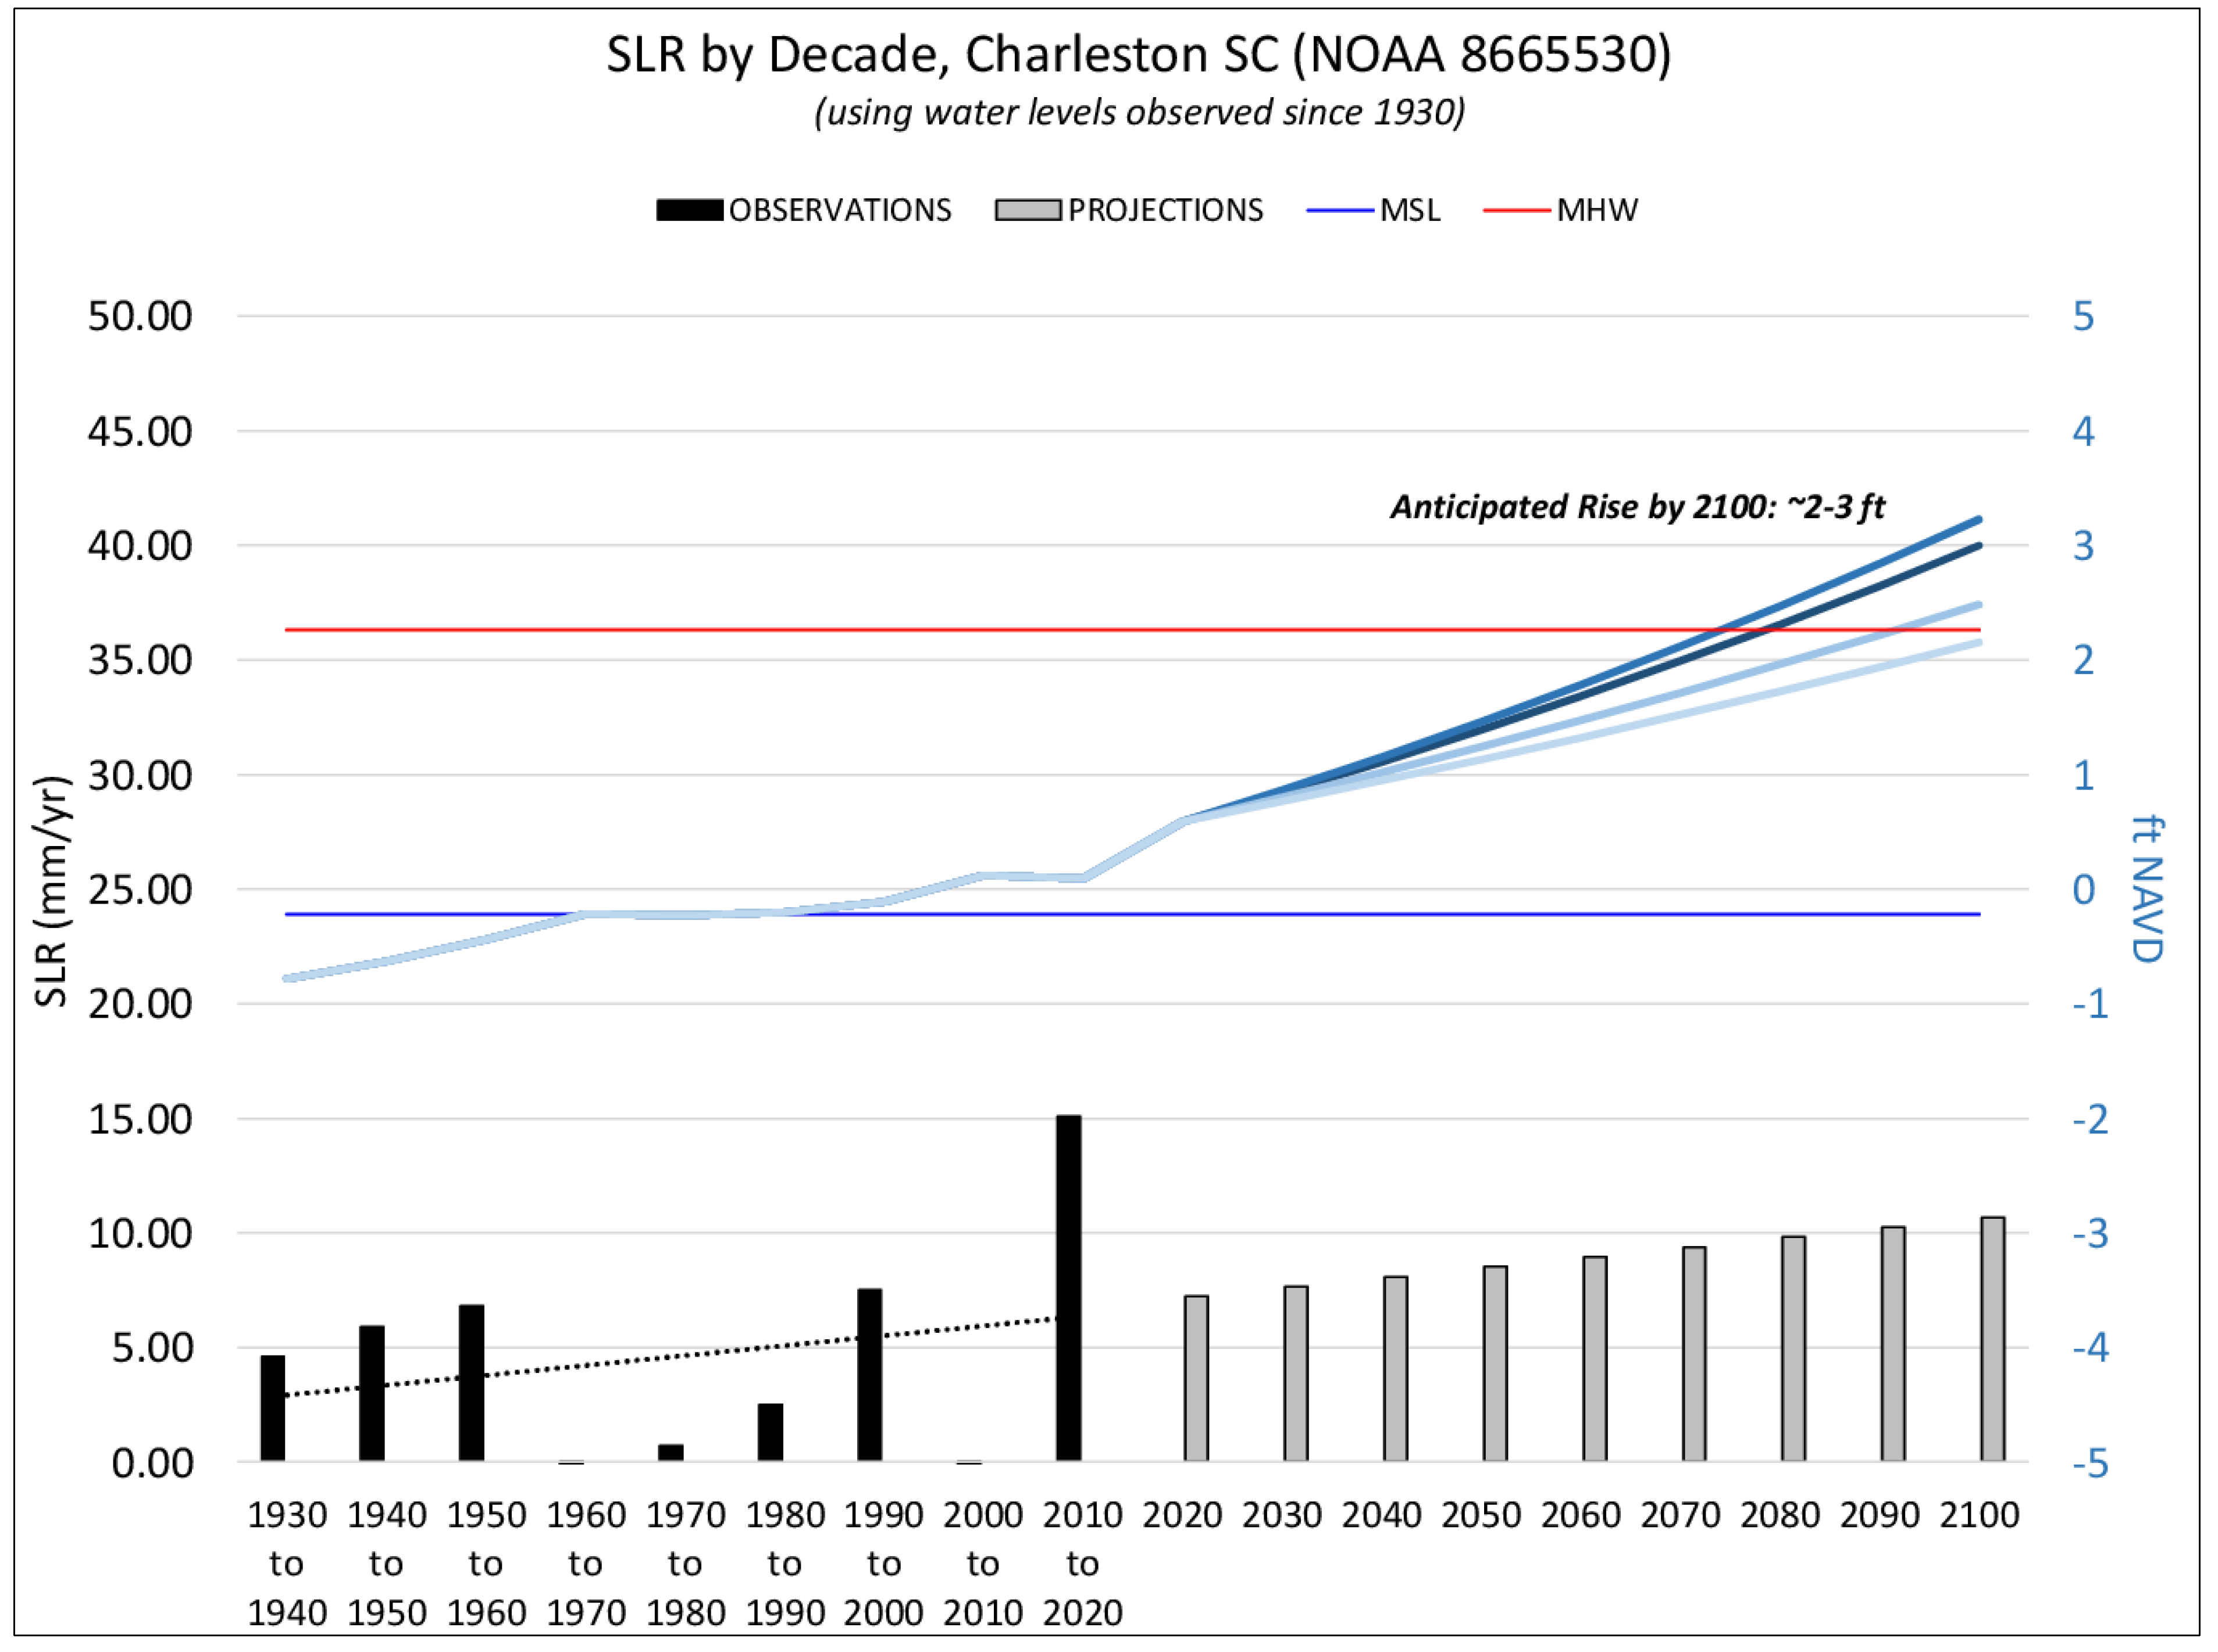
FIGURE A. Observed sea level rise rates from 1930 to 2020 (black bars), with the average decade-to-decade increase (dotted black trend line) used to predict future sea level rise rates through 2100 (gray bars). If the average increase in sea level rise rates from 1930 to 2020 holds steady, 2 to 3 feet of sea level rise are possible by 2100. Current Mean High Water (MHW – red line) would be Mean Sea Level by ~2070.
Trend lines for the past century, at least until 2010, showed a relatively consistent average rate of SLR. However, the past decade is providing the long-anticipated evidence of accelerated SLR. And this is a principal concern with the new IPCC results.
Before 2010, professionals debated whether there was any evidence of accelerated SLR.6,7,8 The rising trend was not debatable. But the tide data at many sites did not exhibit the “hockey stick” graph associated with a distinct increase in the rate of change. In fact, CSE9 discussed the rate of rise in Charleston from 1980 to 2010 as being essentially the same as the 100-year trend. In other words, the EPA’s (1980) Baseline Scenario operated in the Charleston area through the start of the millennium. The SC coast did not even achieve the EPAs “Low Scenario” rates of SLR between 1980 and 2010. But this now appears to be changing. Figure A shows a significant acceleration in SLR since 2010. A similar pattern of acceleration since 2010 has been detected at Fernandina Beach (FL), Wilmington (NC), Oregon Inlet (NC), and Yorktown (VA).
Current IPCC Projections
The IPCC report (AR6) demonstrates the linkages among carbon emissions, global temperatures, ice melting, and sea level rise. The updated scenarios are based on much more input data than was available in 1980. Scenarios of sea level rise are now given for a range of possible future CO2 emissions – all predicated on the degree to which releases of carbon and other greenhouse gasses (GHGs) into the atmosphere increase or are reduced. The report concludes (p. SPM-28):
- Continued ice loss over the 21st Century is virtually certain for the Greenland Ice Sheet and likely for the Antarctic Ice Sheet.
- It is virtually certain that the global mean sea level will continue to rise over the 21st Century
- Relative to 1995–2014 conditions, the likely global mean sea level rise by 2100 is 0.28–0.55 meters (0.9–1.8 ft) under the very low GHG emissions scenario:10 0.44–0.76 m (~1.4–2.5 ft) under the intermediate GHG emissions scenario; and 0.63–1.01 m (~2.1–3.3 ft) under the very high GHG emissions scenario.
AR6 discusses potential worst-case scenarios (eg – 2 m rise with low probability) and warns that these should not be completely dismissed. However, a key takeaway from the present report is the above-likely scenarios are projected with relatively high confidence, meaning the Carolina coast will see at least 1–2 ft SLR in the next 80 years. The report also states with high confidence, “sea level is committed to rise for centuries to millennia due to continuing deep ocean warming and ice sheet melt.”
It is very likely at least an additional 0.5°C of warming will occur by the mid-2030s, and unless steep reductions in emissions are enacted within the next decade (eg – ‘net-zero’ by 2050), an additional 1°C of warming will occur by mid-century. Even with sudden reductions, under the lowest emissions scenario, an additional 1°C of warming is possible by 2100. When considering the full range of emissions scenarios, AR6 presents a very likely increase in global average temperature of 2 to 5°C by 2100; this would represent warming of 1 to 4°C above current conditions.
Continuing temperature increases guarantee continued sea level rise and ice loss, because these systems do not respond to changes in emissions as quickly as global surface temperature. The lag time between warming milestones, ice loss, and sea level rise rates means water temperatures and levels are expected to continue rising through 2100 regardless of the emissions scenario. Global sea level is expected to rise by about 2–3 m (~6–10 ft) some centuries after 2100.
The good news for coastal communities out of all this is the highly likely SLR increases by 2100 (~2–3 ft) fall around the low-range scenarios the EPA published in the 1980s. We believe sea levels in the 2–3 ft range can be managed in many places during the 21st Century. The bad news is even manageable rates of SLR will require collective action and a serious financial commitment. A two-foot rise in Charleston means there will be hundreds of nuisance high tides each year. So, what can be done at the community level?
Two Types of Problems and Two Feasible Responses at the Coast
Accelerating SLR, even if it remains around 2 feet over the next 60 years (Figure B), will have different impacts along the oceanfront compared with sheltered marsh shorelines.
Beachfronts are exposed to waves and winds blowing over loose sands. Wave breaking pushes sand to levels several feet above normal high water. Waves in storms push sands even higher. If there is a surplus of sand, the dry beach will feed the foredune, further increasing elevations along the oceanfront. All these changes in the profile of a beach occur naturally and rapidly.
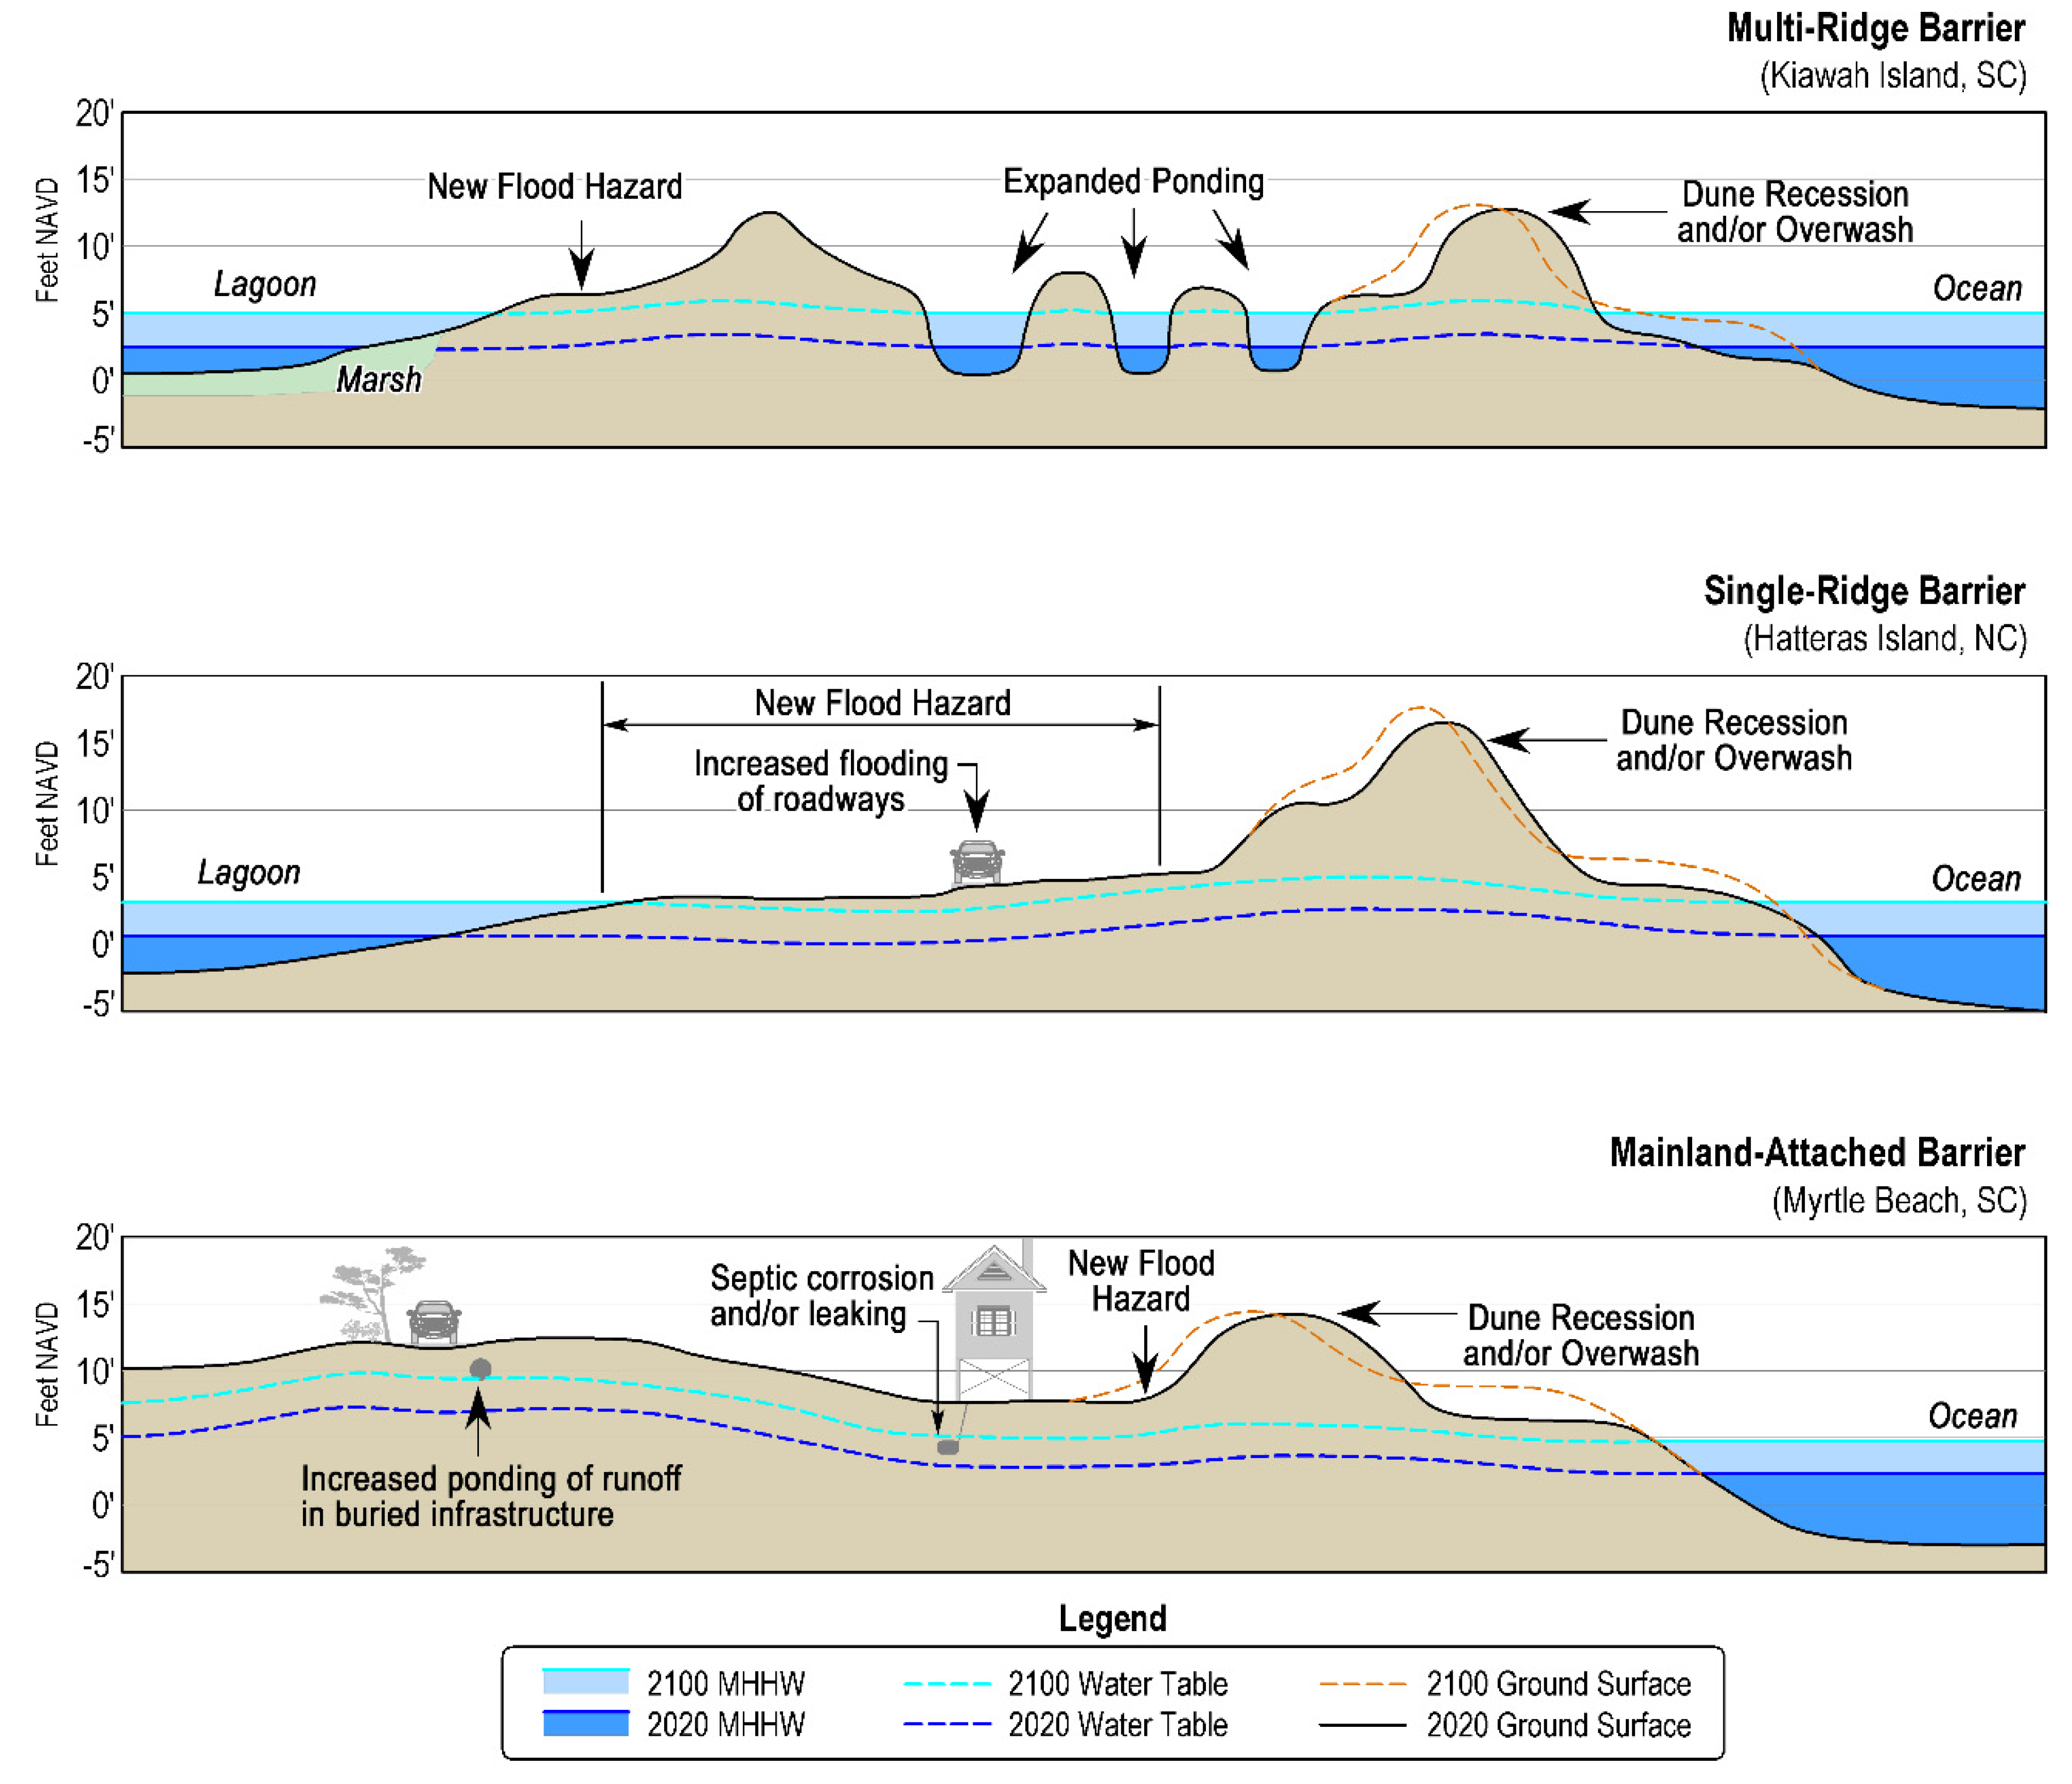
FIGURE B. Barrier Islands responses to SLR will vary depending on the type of barrier, as illustrated above. In barriers with multiple sandy ridges between the ocean and lagoon, stormwater ponds may be the first portion of the system to be impacted by SLR. At the same time, previously-dry swales between the sandy ridges may be more susceptible to flooding. Barriers with a single ridge like on some of the Outer Banks of North Carolina will experience more flooding along the ‘back side’ of the island than the oceanfront. Mainland-attached barriers like those seen in the Grand Strand of South Carolina may not be as vulnerable to flooding, but increases in water table elevations with SLR will expose septic systems and other buried infrastructure to corrosion and leaking.
Marsh shorelines on the backside of barrier islands, by comparison, are often lower than the oceanfront. They are also on the sheltered side of barrier islands, where little wave action or sand is available to build elevation above the high tide line. Similarly, many mainland shorelines fronting sounds and marshes are low-lying. “High ground” adjacent to salt marsh is often just a couple of feet above the mean high watermark. When “King Tides” occur at certain times of the year, water laps into back yards and streets. Causeways crossing marshes and many interior roads in the low country of South Carolina and Georgia are often built at elevations that are easily flooded during storms. These sheltered shorelines tend to be the first to flood under rising seas.
How we deal with SLR along beaches and sheltered shorelines is fundamentally different.
Managing Beaches in the Future
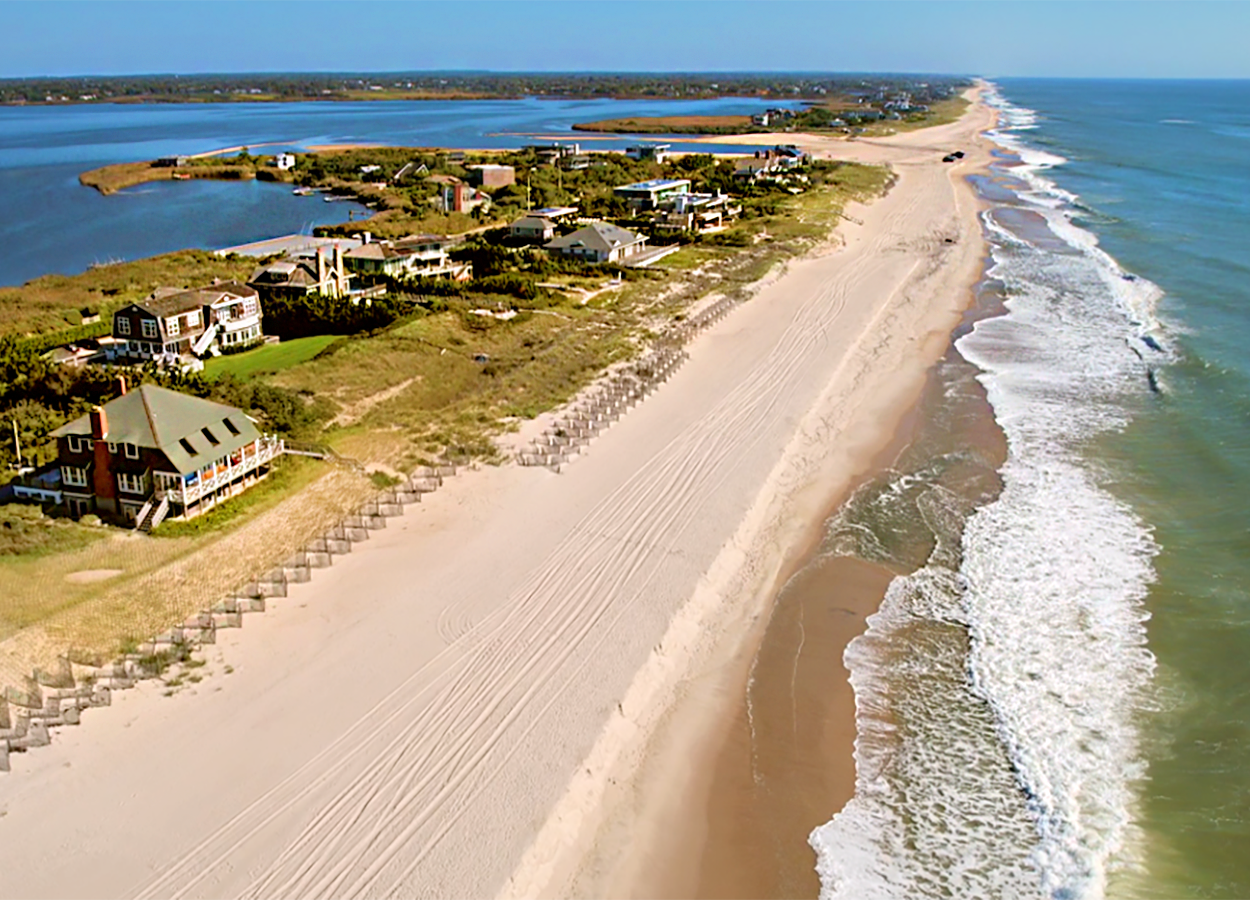
Beaches will naturally adjust to SLR because waves simply do the work of beach building (and erosion) at the level of the tide. The profile of the beach will be displaced upward and landward in proportion to the rise of the mean tide level. The amount of displacement is related to many factors, but for beaches in equilibrium,11 a one-foot rise in sea level equates to 15–30 ft of landward shoreline movement. The change depends on the natural slope of the beach. For CSE project sites in Long Island (NY) and the Outer Banks of North Carolina, the average displacement will be ~20 ft. For South Carolina low country beaches like Hunting Island and Hilton Head, there will be a greater shift (~30 ft) because the natural beach is more gently sloping.
The huge variation in shoreline changes from place to place relative to the effects of SLR complicates interpreting beach erosion through the lens of sea levels. In a given year, if sea level rises 5 mm, the shoreline will shift ~10–20 cm (0.4–0.8 ft) due to inundation by the higher mean tide line. But most beaches change by greater amounts during the passage of a single cold front or tropical system. The background ‘noise’ related to all the possible ways and rates sand moves from one section of beach to another makes identifying acute impacts of SLR difficult, if not impossible, on most beaches. A nearby inlet may draw off sand, while another may deposit large volumes in the form of migrating sand bars. In our experience, these local conditions control erosion rates and dwarf the effects of SLR.
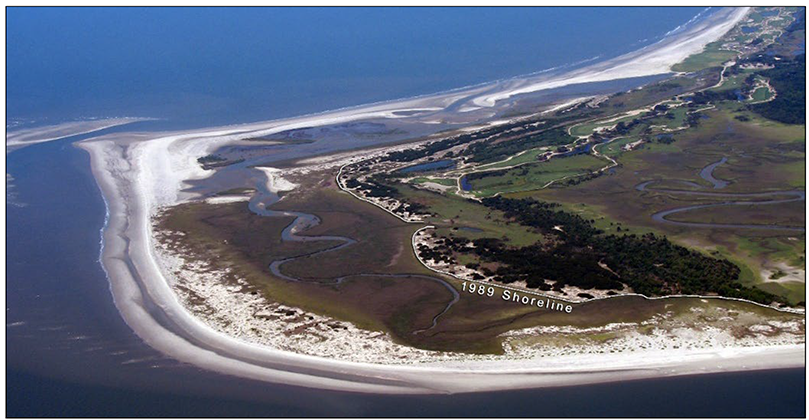
FIGURE C. The eastern end of Kiawah Island in 2008, exhibiting substantial seaward growth in the dry beach location over a ~20-year period (note 1989 shoreline). This growth occurred because of sand migrating onshore from the nearby inlet shoals in quantities great enough to build a new outer beach and dune system faster than erosion could shift the sand downcoast.
The evidence from nature proves that beaches can grow under rising seas if there is excess sand in the system (Figure C). We observe this at places like Kiawah Island (SC) or east of Shinnecock Inlet (NY), where sand moving onshore or alongshore accumulates. Accreting beaches will generally fare well under current SLR projections. However, management of SLR along chronically eroding beaches will require inputs of sand to the system to at least keep pace with SLR and counteract the local factors that cause most of the erosion.
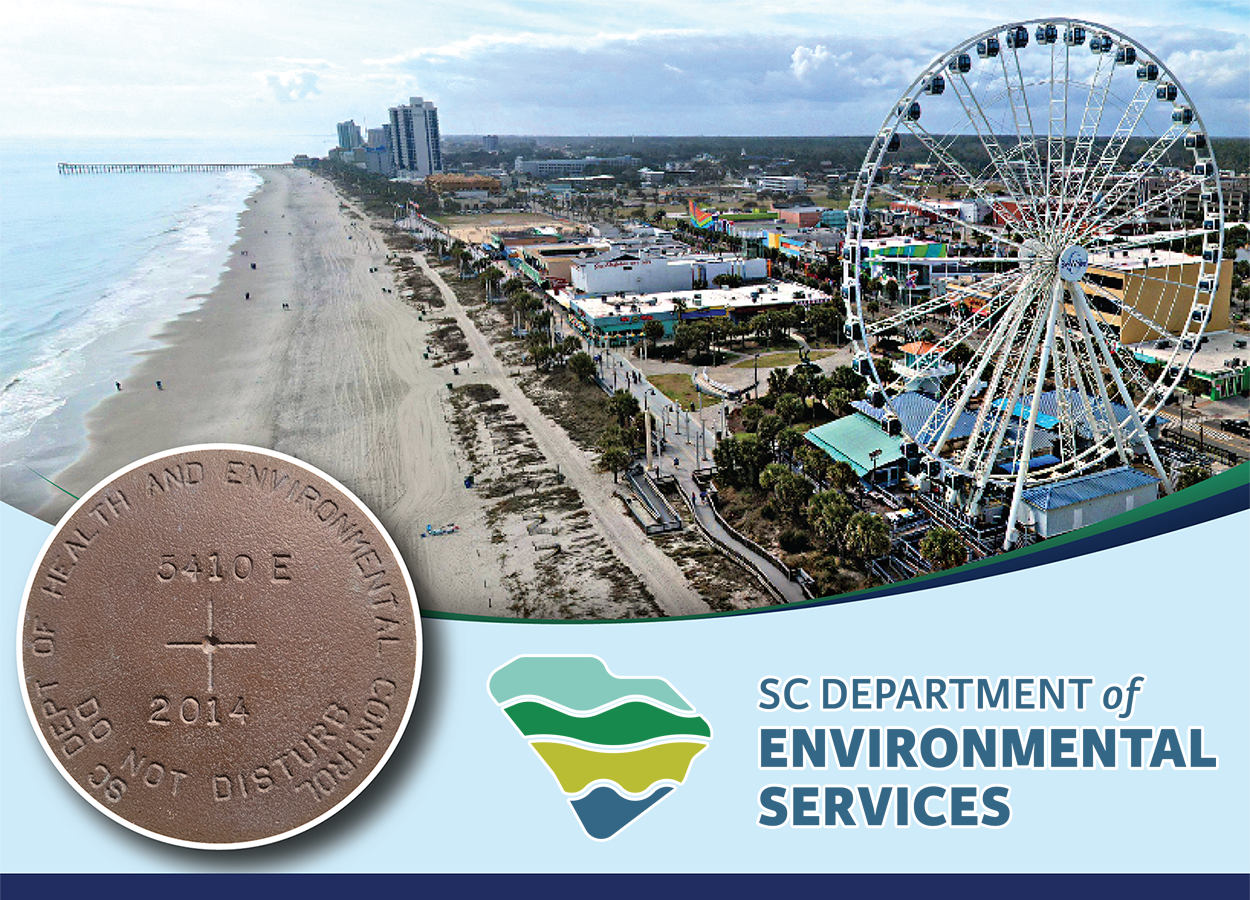
Communities that have low beach erosion rates (<3 ft per year) tend to be excellent candidates for nourishment projects because less sand is needed to offset erosion, and projects may last many years. When erosion is 6–10 feet per year, it will take 2–3 times as much sand to maintain the same shoreline position. Periodic surveys are the key to determining how much sand is lost each year and what volume is needed to keep pace with erosion. Many beach towns like Myrtle Beach (SC) began nourishment programs in the 1980s in response to degraded beaches. Sustained efforts over decades have gone well beyond simply holding the shoreline in place (Figure D). Beaches have been widened, and dunes have grown larger and more protective.
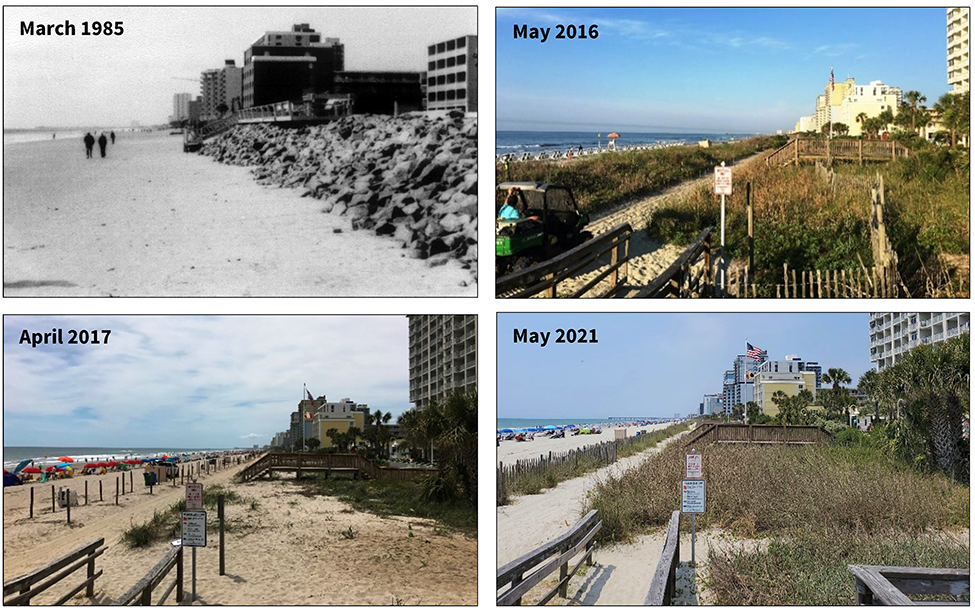
FIGURE D. The natural beach erosion rate at Myrtle Beach measured ~1 to 2 ft/yr for decades, and has been offset by a sustained beach nourishment program enacted since the mid-1980s. A total of ~6.2 million cubic yards of sand have been placed along Myrtle Beach since 1986 in five separate nourishment projects. This volume of sand has not only kept pace with erosion, it has moved the high water mark over 100 ft seaward and prevented damage to properties.
CSE’s recommended approach for managing beaches in the future under accelerating SLR at likely rates predicted by the IPCC includes:
- Quantify sand deficits and erosion rates to establish a target dry-beach condition
- Add quality sand to offset the deficit and keep pace with erosion
- Elevate buildings and maintain separation between the normal high tide line and developed property
- Maintain and enlarge the foredune
- Track project performance objectively via measurements encompassing the entire littoral profile across the surf zone
For each foot of SLR, every mile of developed beach will need 100,000 to 300,000 cy to keep pace with gradual inundation of the sea, and hold the shoreline position constant. This volume will be gained naturally along many accreting shorelines like Salvo in the Outer Banks of North Carolina, the east end of Kiawah Island, South Carolina (Fig C), or Southampton, New York, east of Shinnecock Inlet. But along eroding shorelines, several more times than these volumes will be needed to offset erosion. A long thin strand of new sand every 5–10 years will buy time and help maintain viable beaches, protecting property, and maintaining the local tax base while the community can determine appropriate long-term solutions for SLR.
Managing Sheltered Shorelines into the Future
A barrier island is typically higher along the oceanfront and slopes more gently toward the marsh. Where multiple dune ridges occur, such as over many South Carolina and Georgia “sea islands,” swales inhibit stormwater drainage across the island. Narrow barrier islands like much of the Outer Banks and the south shore of Long Island follow a simpler profile with fewer ridges and a broad low platform trailing into the landward bays and sounds. In either case, low-lying swales, ditches, or creeks serve to drain the island.
Strategies for managing SLR along sheltered shorelines should start by considering the natural terrain and the way the land drains. To minimize impacts of flooding on individual properties, the highest ground needs to be under buildings, not at the edge of the marsh where bulkheads and filling are commonly a first response. Neighborhoods situated in mid-island swales where stormwater accumulates may need to install more pipes or pump systems. Existing drainage networks, including ditches, culverts, roadways, and natural channels, should be catalogued by communities in order to identify choke points that cause floodwaters to back up and remain longer than necessary.
Access roads, including causeways to the beach and interior roads in low areas, should be elevated by fill to keep pace with the rising tide levels. Nuisance tides at low-lying sections of roads near tidal creeks will become exponentially more frequent with SLR.12 Such locations are already known in many communities, so an easy first step is to raise those sections of roads most prone to everyday flooding. As roads are elevated, drainage may be restricted in new ways, so culverts must be installed under roads with sufficient capacity to handle expected ponding and runoff.
Low, “washover” barrier islands will be more vulnerable under present SLR scenarios. Galveston Island (TX) demonstrated this following the Great Hurricane of 1900, which wiped out the city and killed thousands.13 Following the storm, the island was raised over six feet by pumping sand from the lagoon. Buildings were raised to accommodate much higher storm surges. Seawalls were built along the oceanfront, and nourishment was performed to restore the beach. These erosion mitigation measures have largely spared modern-day Galveston from severe storm damage. Because elevation largely determines flood risk, the resilience of barrier islands depends on increasing elevations to keep pace with rising sea levels.
Most communities will have difficulty implementing an approach modeled after Galveston, because large-scale structural or hybrid structural/non-structural flood mitigation methods are many times more expensive than nourishing and maintaining just the oceanfront. Consider the land areas involved. The beachfront is typically 100-200 ft wide, whereas low back-barrier and mainland shores around estuaries may be thousands of feet wide. In places like Louisiana, where SLR is several times greater than Charleston, attempts to keep pace with marsh loss and drowning of wetlands are futile because there is not enough sediment available to reclaim the land. The volumes required to mitigate SLR over marshes and lowlands dwarf volumes needed for beach preservation.
In some locations, a hybrid combination of sediment placement, tide gates, flood barriers, and pump systems have been proposed to mitigate flood risk in the face of rising sea levels. Such approaches have been implemented famously in the densely-populated Rhine Delta by the Dutch, and in and around the city of New Orleans. In those cases, a robust shipping industry and a large population justify the cost of such an approach. The Deltawerks improvements in the Netherlands cost ~$4 billion in 1990, closer to ~$8 billion today. Post-Hurricane Katrina improvements to the New Orleans flood protection system cost ~$14 billion, and only renovated an existing system. In Texas and New Jersey, costs for the hybrid approach range from ~$15 billion to more than $30 billion. These costs are prohibitively high for many small- to medium-size communities.
A combination of mitigation and avoidance represent the most cost-effective methods for minimizing the worst SLR impacts. Structural, non-structural, or hybrid solutions can be combined with relocating infrastructure, or adaptive land uses to avoid the worst SLR impacts. However, two factors constrain solutions to future SLR along sheltered shorelines in the US: access and prescriptive laws protecting tidal wetlands. As a result, community-wide efforts are relatively rare. Instead, individual property owners tend to follow the model of oceanfront owners in the 1970s and install bulkheads, rip rap, or other composite shore protection, then raise backyards with imported sand or soil.
Living shorelines (often a community solution) are sometimes able to recreate a salt marsh or reef buffer via the installation of low sills close to shore and backfilling with spoil to the marsh level. While this is an innovative approach favored in some areas, such solutions may leave low, poorly drained areas on adjacent property, thereby exacerbating flooding elsewhere. Additionally, regulatory guidance on specifications for living shoreline projects is generally not as robust as that for oceanfront nourishment or hardened structures such as seawalls or riprap. Because living shorelines can only provide a minor buffer against higher water levels, even with these projects in place, development along the marsh edge and low areas of barrier islands will sustain more frequent flooding and standing water under accelerated SLR.
In summary, the response to accelerated SLR around sheltered shorelines will necessarily be different than the oceanfront. CSE recommends coastal communities consider sponsoring a sea level rise mitigation study in order to catalogue vulnerabilities and prioritize mitigation methods. Such a document would identify favored practices to accommodate future sea levels and more frequent flooding, including:
- Improve drainage, and install pumps where necessary
- Raise access roads
- Avoid shore protection measures such as bulkheads which exacerbate runoff
- Place protective structures and fill as close to buildings as possible, so stormwater drains away from houses
- Maintain landscaping so stormwater can return to the ground more rapidly
These recommendations are just a start, but they highlight practical solutions that are within the means of most communities. Ultimately, the right solution for any locality will be specific to the conditions on the ground and the degree to which residents wish to reduce coastal hazards.
For more information on how your community can respond to rising seas and more frequent storms, contact any of our professionals.
Written by: Tim Kana, PG, PhD & Patrick Barrineau, PG, PhD – September 2021
Coastal Science & Engineering (CSE) is an award-winning team of scientists and engineers with 30 years of experience developing innovative engineering solutions to coastal development and beach erosion problems.
NOTES & REFERENCES
- The Intergovernmental Panel on Climate Change was formed by the United Nations to provide regular assessments of the scientific basis of climate change, its impacts and future risks, and options for adaptation and mitigation. The panel currently has 195 members from around the world, with dozens additional scientists making contributions to each report.
- The National Academy of Sciences (NAS Press) published Understanding Climate Change in 1982, referencing work by many researchers such as Dr. JE Hansen at NASA’s Goddard Space Institute. He developed some of the earliest global climate models.
- Kana, T.W., J. Michel, M.O. Hayes, and J.R. Jensen. 1984. “The Physical Impact of Sea Level Rise in the Area of Charleston, South Carolina.” In: Barth and Titus (eds) Greenhouse effect and sea level rise : a challenge for this generation. (pp 105-150) New York : Van Nostrand Reinhold.
- Titus, James G. 1984. “Planning for Sea Level Rise Before and After a Coastal Disaster.” In: In: Barth and Titus (eds) Greenhouse effect and sea level rise : a challenge for this generation. (pp 1-56) New York : Van Nostrand Reinhold.
- Hicks, S.D., H.A. Debaugh, and L.E. Hickman. 1983. Sea level variations for the United States, 1855-1980. Rockville, Md: U.S. Dept. of Commerce, National Oceanic and Atmospheric Administration, National Ocean Service.
- Church, J.A. and N.J. White. 2006. 20th century acceleration in global sea-level rise. Geophysical Research Letters, 33, L01602, doi:10.1029/2005GL024826.
- Woodworth, P.L., N.J. White, S. Jevrejeva, S.J. Holgate, J.A. Church, and W.R. Gehrels. 2009. Evidence for the accelerations of sea level rise on multi-decade and century timescales. International Journal of Climatology, 29, pp 777–789, doi:10.1002/joc. 1771.
- Houston, J., and R. Dean. 2011. Sea-Level Acceleration Based on U.S. Tide Gauges and Extensions of Previous Global-Gauge Analyses. Journal of Coastal Research. 27. pp 409-417. 10.2307/29783261.
- Kana, T.W., S.B. Traynum, D. Gaudiano, H.L. Kaczkowski, and T. Hair. 2013. The physical condition of South Carolina beaches 1980–2010. Jour Coastal Research, Special Issue 69, pp 61-82.
- This scenario calls for warming to be held at or below 1.5°C by 2100 compared to 1900, and for ‘net-zero’ CO2 emissions by 2100. ‘Net-zero’ emissions represent the condition in which removals of atmospheric carbon exceed emissions. Many parties signed onto the Paris Accords with this scenario as a goal. The ‘intermediate’ GHG scenario is approximately in line with the upper end of aggregate emissions agreed to in the Paris Accords, while the ‘very high’ scenario assumes no additional climate policy beyond what is in place today.
- Beaches composed of small sand grains are mobile and develop a sloping profile into the water in accordance with the average size of waves breaking at the shoreline. Sand will tend to move further underwater when waves are higher than normal or move onshore during calmer conditions. When the onshore-offshore movement of sand balances and there is negligible loss of sand in the alongshore direction, the beach is considered to be in dynamic equilibrium. In simple terms, the sand box (‘littoral zone’) along the coast keeps holding the same volume of sand.
- Kriebel, D.L, J.D. Geiman, and G.R. Henderson. 2015. Future flood frequency under sea-level rise scenarios. J. Coastal Research Vol 31(5) pp 1078-1083.
- Larson, E. 1999. Isaac’s Storm: A Man, A Time and the Deadliest Hurricane in History. Random House, New York, NY, 336 pp.